Standards
Data Quality Profiling Requirements Matrix
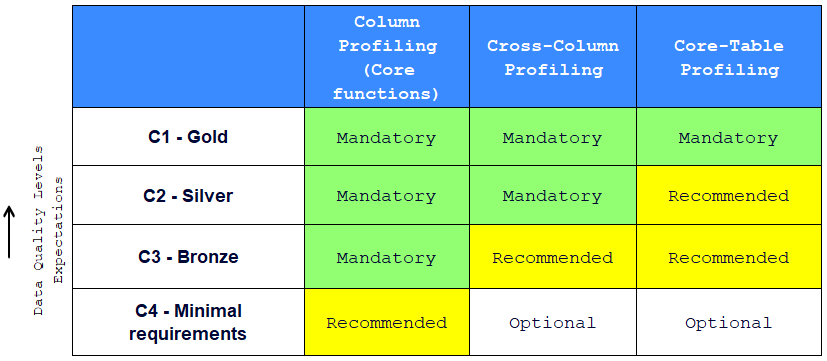
Data profiling might not be required in all cases, the following matrix is the proposed standard to assess the applicability of Data profiling per category of data:
![]() Disclaimer: Please note that the proposed table is based on industry best practices. When necessary, it can be customized to meet local specificities and requirements.
Disclaimer: Please note that the proposed table is based on industry best practices. When necessary, it can be customized to meet local specificities and requirements.
An airport uses detailed protocols for passenger and baggage screening. Similarly, the Data Quality Profiling Requirements Matrix guides analysts on when and how to apply different profiling techniques. These standards make it possible to assess the need for profiling based on the category of data, ensuring effective resource management.
Data Quality Profiling Categories Matrix
The following Matrix presents the standard types of profiling that are recommended in the enterprise with their description and their impact on Data Quality dimensions
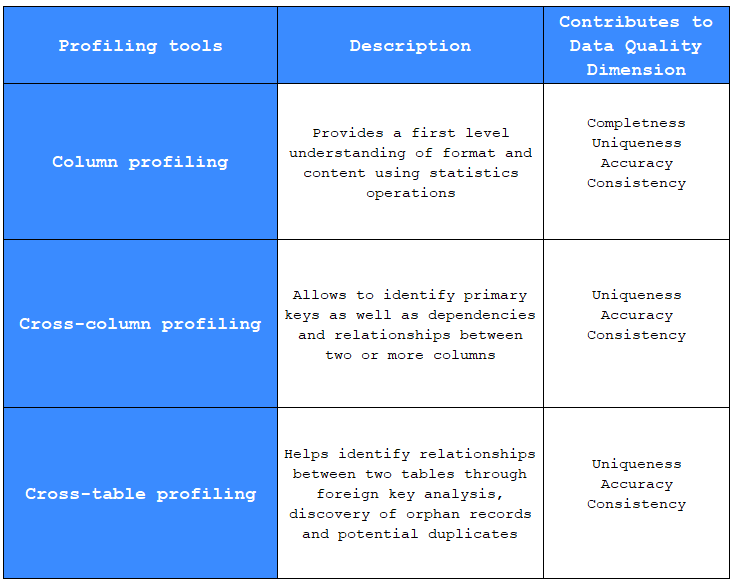
This matrix is comparable to the different levels of security checks at an airport, where each type of check (such as x-ray screening, document verification, or biometric checks) is designed to validate different aspects of passenger security. Similarly, each type of profiling - Whether column, cross-column or cross-table profiling – is standardized to ensure that data quality dimensions such as completeness, uniqueness, Accuracy and consistency are systematically assessed.
Column Profiling:
Description: Column profiling provides an initial understanding of the format and content of a specific column using statistical operations. These operations might include calculating descriptive statistics such as mean, median, minimum and maximum values, as well as counting null or non-null values.
Contributes to Data Quality Dimension:
Completeness: By identifying missing or null values within a column.
Uniqueness: By detecting duplicates, ensuring each entry is unique if necessary.
Accuracy: By ensuring data matches expected formats and types.
Consistency: By checking that data within the column is consistent with other data.
Cross-Column Profiling:
Description: This type of profiling identifies primary keys as well as dependencies and relationships between two or more columns. This can involve detecting functional relationships, such as whether one column can be used to predict the value of another.
Contributes to Data Quality Dimension:
Uniqueness: By confirming that combinations of columns form unique keys.
Accuracy: By establishing accurate and logical relationships between columns.
Consistency: By maintaining data integrity across column relationships.
Cross-Table Profiling:
Description: Cross-table profiling assists in identifying relationships between different tables through foreign key analysis, discovery of orphan records (those that don’t match any foreign key in another table), and pinpointing potential duplicates across tables.
Core Column Profiling operations
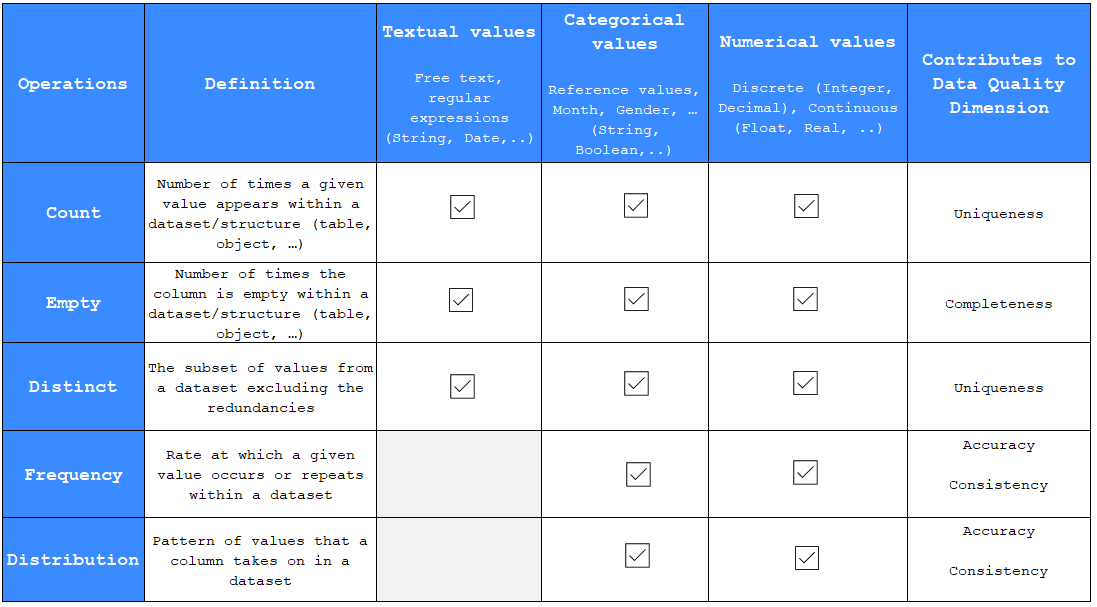
Profiling operations are like the tools and technologies used to manage and monitor passenger flows and flight operations. Each operation (such as counting, measuring frequency, or identifying distinct values) helps maintain data integrity and quality. These operations are essential for detecting errors, inconsistencies or duplication, just as airport security inspections are crucial for preventing risks.
Operations and their Descriptions:
Count: This operation tallies how many times a particular value occurs within a dataset or data structure (like a table or object).
Empty: This measures how many times a column in a dataset is empty, which helps to track the completeness of the data.
Distinct: Identifies the unique values in a dataset by removing duplicates, contributing to the uniqueness of the dataset.
Frequency: Determines the rate at which a particular value appears in the dataset, which can contribute to understanding data accuracy and consistency.
Distribution: Looks at the pattern of values within a column across a dataset to assess data accuracy and consistency.
- Types of Values Analyzed:
Textual values: letters, strings of numbers, symbols and spaces, etc.
Categorical values: Data that can be categorized, such as months, gender, Boolean values, etc.
Numerical values: Quantitative values, which can be discrete (like integers or decimals) or continuous (like floats or reals).
- Contribution to Data Quality Dimensions:
Uniqueness: Ensured by counting and identifying distinct values, confirming that each value is used only once where necessary.
Completeness: Measured by identifying empty fields within the data, ensuring that the dataset is fully populated.
Accuracy: Assured by frequency and distribution analysis, confirming that the data values are what they are supposed to be and are represented correctly.
Consistency: Supported by frequency and distribution checks to confirm that the data is logical and consistent within the dataset and across different datasets.
Additional Column Profiling operations
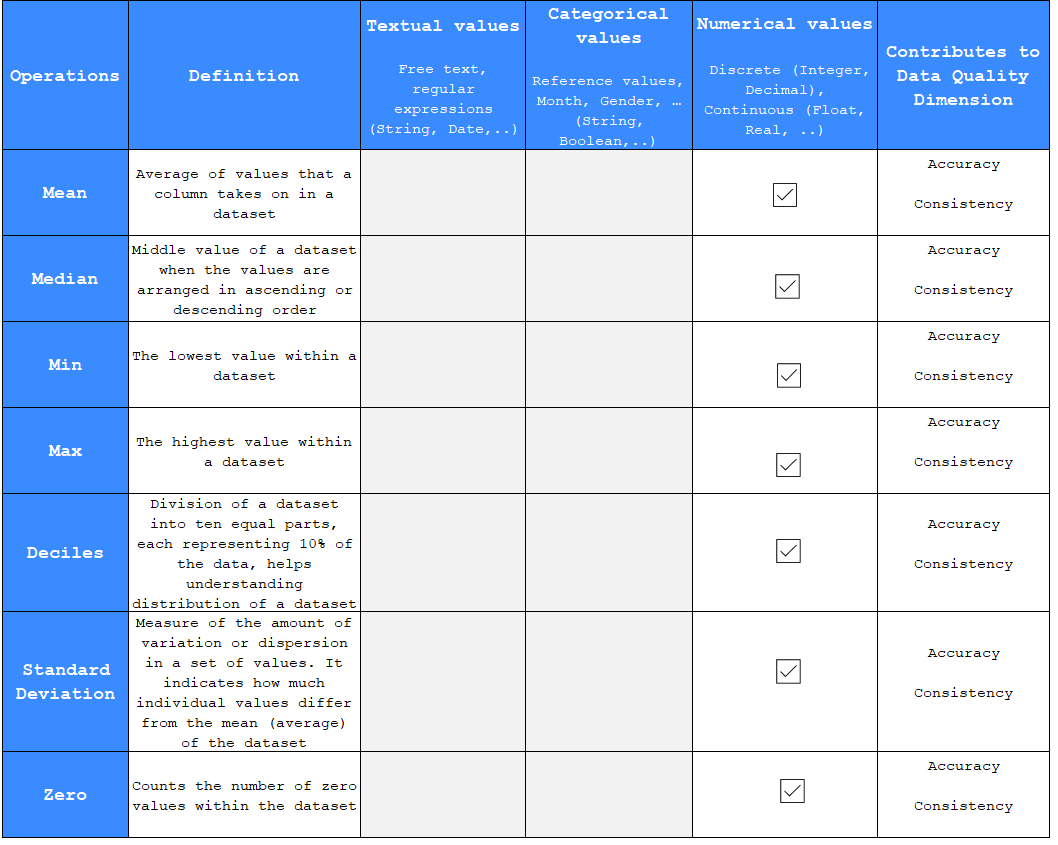
Measures and Their Descriptions:
Mean: The average of values in a column across a dataset. It provides a central tendency, which is the sum of all values divided by their count.
Median: The middle value of a dataset when all values are arranged in ascending or descending order. It represents the central point of the dataset and is less affected by extreme values than the mean.
Min: The smallest, or lowest, value in a dataset. Identifying the minimum value can indicate the range of data and potential data entry errors.
Max: The largest, or highest, value in a dataset. Like the minimum, the maximum value can reveal the range and possible outliers or errors.
Deciles: These are values that divide the dataset into ten equal parts, with each part representing 10% of the data set. This helps in understanding the distribution of the data, identifying patterns, or spotting outliers.
Standard Deviation: A measure of the amount of variation or dispersion of a set of values. A low standard deviation means that most of the numbers are close to the mean (average), while a high standard deviation means that the values are spread out over a wider range.
Zero: This counts the number of zero values within the dataset, which can be important for identifying patterns, such as the frequency of non-occurrences or absence of certain conditions.
- Types of Values Analyzed:
Discrete: These are countable values like integers or decimals.
Continuous: These values can be measured and can include real numbers or floats.
- Contribution to Data Quality Dimensions:
Accuracy: These measures help ensure that numerical data is represented accurately and can highlight errors or inconsistencies in data entry or processing.
Consistency: Statistical measures can help verify that data is consistent across datasets. For example, if the standard deviation of a normally distributed set of data is significantly different from one dataset to another, it might indicate an inconsistency.
Expected and Observed Data Quality Levels
The following table presents the outcome of the steps “Dataset Identification”, “Expected Data Quality Levels”, “Data Quality Profiling Requirements”
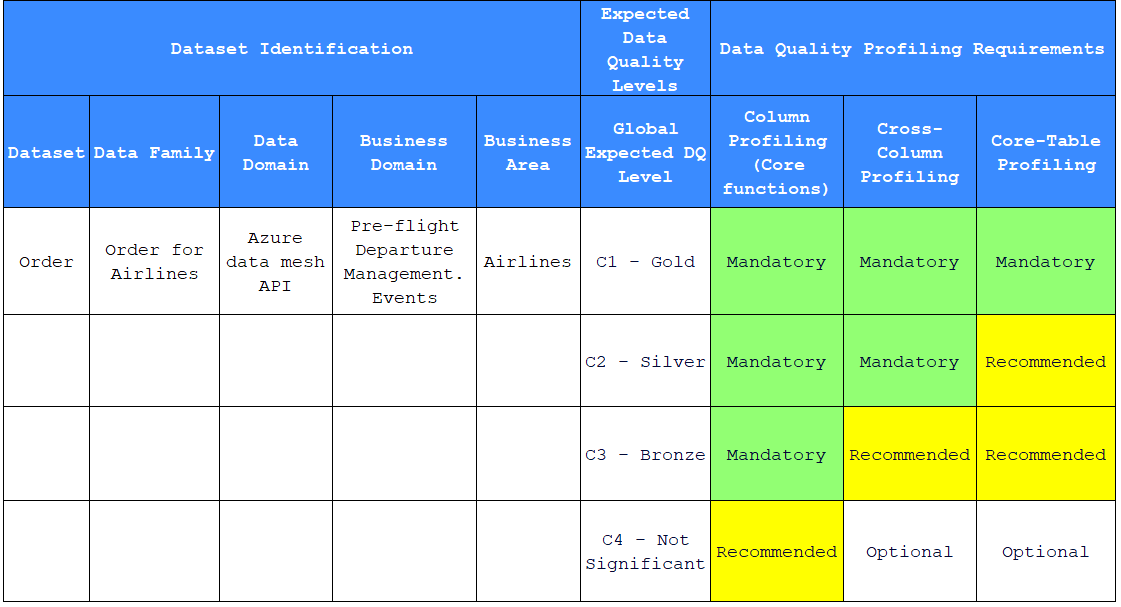
Dataset Identification: provides a framework for categorizing data. In this board, a dataset named “Order” in the “Order for Airlines” data family is linked to the Azure data mesh API in the data domain and is related to pre-flight departure management events in the airlines business domain. This helps to contextualize the data usage and define its relevance to the business. A concrete case that the enterprise may encounter.
Expected Data Quality Levels: indicate the relative importance of datasets. For “Order”, the expected Data Quality level is “C1 - Gold”, indicating it’s of critical importance and, as such, must adhere to the highest quality standards.
Data Quality Profiling Requirements: details the profiling activities required to ensure compliance with the expected quality levels. For a dataset with a “Gold” level, column profiling, cross-column profiling, and cross-table profiling are mandatory. This means a comprehensive evaluation is necessary to understand the structure, consistency, and integrity of relationships within and across database tables.
Summary
The list of columns, set of columns and set of tables that are subject to profiling checks will be determined by Data Owners, Data Stewards and Data Quality teams on the basis of the Data inventory with expected level of quality.
Data Profiling template
Please refer to the Data Quality Framework documentation center