BDO Monitoring Standards
- Monitoring standards at BLDO level include High level dashboards for Business Data Office:
High level dashboards for Business Line Data Office
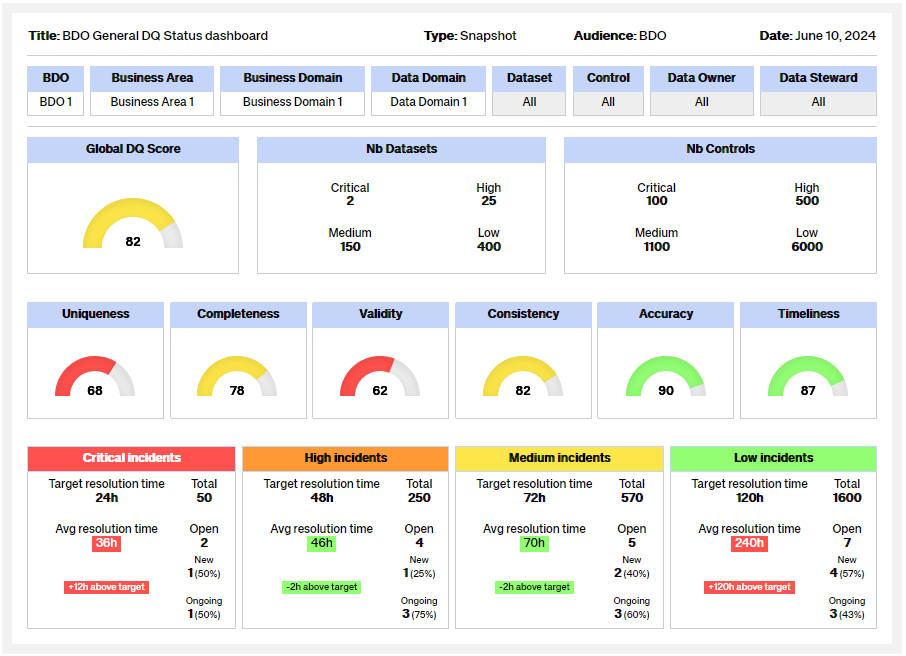
Snapshot of BLDO General DQ Status
This dashboard, which is communicated by BLDO to CEDO, allows visualizing the state of data quality within BDO scope.
It adds detail on remediation workflows: Incidents being processed and average resolution time.
From this dashboard, it is possible to drill down to a more detailed view for a given perimeter with the “DQ Status dashboard”
![]() Information: Please refer to the Key terms and abbreviation section for the definition of terms used in the dashboards. Please note that figures provided in the dashboard are illustrative examples. For more details about calculating the overall score.
Information: Please refer to the Key terms and abbreviation section for the definition of terms used in the dashboards. Please note that figures provided in the dashboard are illustrative examples. For more details about calculating the overall score.
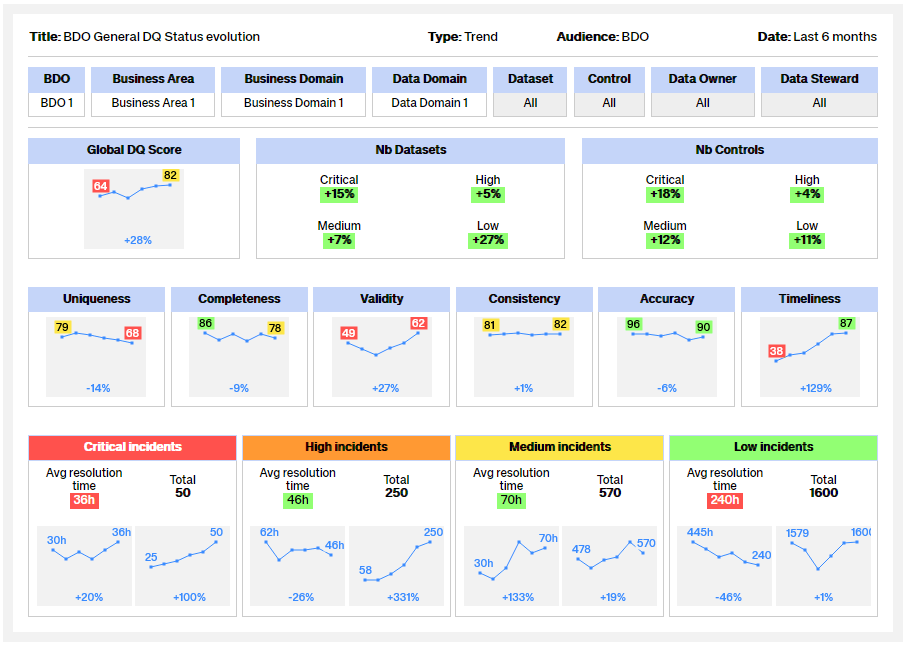
Trend of BLDO General DQ Status
This dashboard, which is communicated by BLDO to CEDO, allows visualizing the trend of data quality within BLDO scope for a given time period.
The presentation of indicators over time makes it possible to project into the future and make long-term decisions.
From this dashboard, it is possible to drill down to a more detailed view for a given Data Owner with the “DQ Status dashboard”
![]() Information: Please refer to the Key terms and abbreviation section for the definition of terms used in the dashboards. Please note that figures provided in the dashboard are illustrative examples. For more details about calculating the overall score.
Information: Please refer to the Key terms and abbreviation section for the definition of terms used in the dashboards. Please note that figures provided in the dashboard are illustrative examples. For more details about calculating the overall score.
Note: an overall score is not achieved by an average.
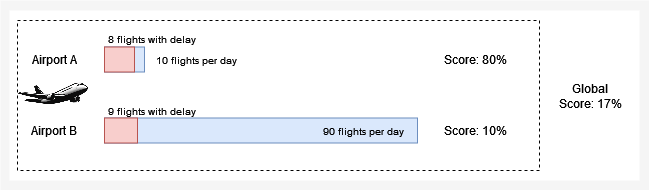
Imagine you manage a network of two airports, Airport A and Airport B. Each airport has a different number of flights per day, and unfortunately, some of these flights experience delays.
Airport A is smaller and handles 10 flights per day. Of these flights, 8 are delayed. This equates to a high error rate of 80%, highlighting a serious problem at this airport that affects the majority of flights.
Airport B, on the other hand, is an international airport with 90 flights per day, but only 9 are delayed. This represents a much lower error rate of 10%, indicating that this airport is operating relatively well despite high traffic volume.
If we were to calculate the data quality score for these two airports individually, we would simply say that Airport A has a quality score of 80% errors and Airport B has 10% errors. However, to assess the overall performance of the airport network, we need to look at the combined data from both.
For the entire network, we consider total flights and total delays. Together, the two airports handle 100 flights per day, with 17 delays in total (8 from Airport A and 9 from Airport B). The data quality score for the network, in this case, is calculated by dividing the total number of delays by the total number of flights, giving us 17% errors.
This calculation is essential because it is not simply a matter of taking the average of the quality scores of each airport (which would give 45%), but rather of evaluating performance on the basis of all the operations. This more accurately reflects the overall impact of data quality issues, in our analogy, the delay rate, taking into account each airport’s proportional contribution to the total traffic volume. This is a crucial mathematical nuance for understanding how different data segments influence the overall outcome in real-world situations such as managing airport operations in a network.
A combined approach more accurately reflects the overall impact of data quality issues.
Monitoring template
Please refer to the Data Quality Framework documentation center.